NEO Planner V5.0 - Execute Search - Explanations
The new Execute Search feature was developed jointly by the NEO
Planner user team. Knowledge of spherical geometry was essential for displaying
the star map and calculating the mosaic positions.
Many thanks to P. Christoph Gerhard OSB and Bernd Koch for their valuable tips and
formulas! The decoding of the UCAC-3 binaries and the programming work was
accomplished with the help of my talents.
Within the picture, click on the area that you want to be explained: (not in all browsers available)
The Execute Search function creates
two files in the planning folder of NEO Planner for loading into
N.I.N.A.
On the one hand an XML file for loading in the sequencer's
open target set, on the other hand a JSON file for loading in the advanced
sequencer.
The mosaic feature can be used for all observing purposes, including deep sky observing.
Active camera. Clicking takes you to the CCD parameters and you can select the active camera there.
Width and height of the camera field:
The size of the active camera's sensor in arcmin.
Width and height of the mosiac:
Size of the entire recording area according to the mosaic size. (Mosaic selection area)
Mosaic selection:
Amount of the overlap of the individual mosaic fields in percent
in right ascension and declination.
The overlap is calculated correctly and the positions in the JSON and XML file
are correct. The display in the starmap is still being revised.
Specifies the size of the mosaic. A maximum of 10 rows and 10 columns is possible.
Central position of the mosaic. This also forms the center of the mosaic in the star field.
There is an exam for the existence of the deep sky object. Any
catalog designation can be entered.
The object is then centered in the middle of the mosaic and displayed with its
size and orientation.
N.I.N.A. selection:
Execute start time in hours and minutes:
in local time.
Exposure time and number of images/one mosaic field:
When searching for Near Earth Objects, the key is to find
objects moving faster than Main Belt asteroids or comets.
We recommend an exposure time of approx. 30 seconds and at least 36 images per
series for a search with the help of the Tycho Synthetic Tracker
Also if you blink the picture series with your eyes about 30 images per mosaic
field are recommended.
Experience has shown that objects up to approx. 19 mag can be flashed visually under these conditions taken with high-intensity sensors.
The sequence of shots for N.I.N.A. follows this rule:
The telescope is positioned from lower R.A. to higher R.A. First, all columns
per lower R.A. positioned,
then jump to the nearest higher R.A. and processing of all columns and so on.
Star map selection:
Vmag and Check Boxes:
The faintest Vmag brightness of stars and galaxies can be set. Objects from the S function in Revise are not affected.
With deep sky: checked -> display galaxies
both from the
UCAC-3
and
the revised NGC/IC
catalogs.
With designations: checked -> displays existing designations of
deep sky objects in the NGC/IC catalog.
Without SFx: checked -> The numbers of the mosaic fields are not displayed in
the SFx format.
Switch N/S: The display of the objects in the starmap are mirrored vertically.
Switch E/W: The display of the objects in the starmap are mirrored horizontally.
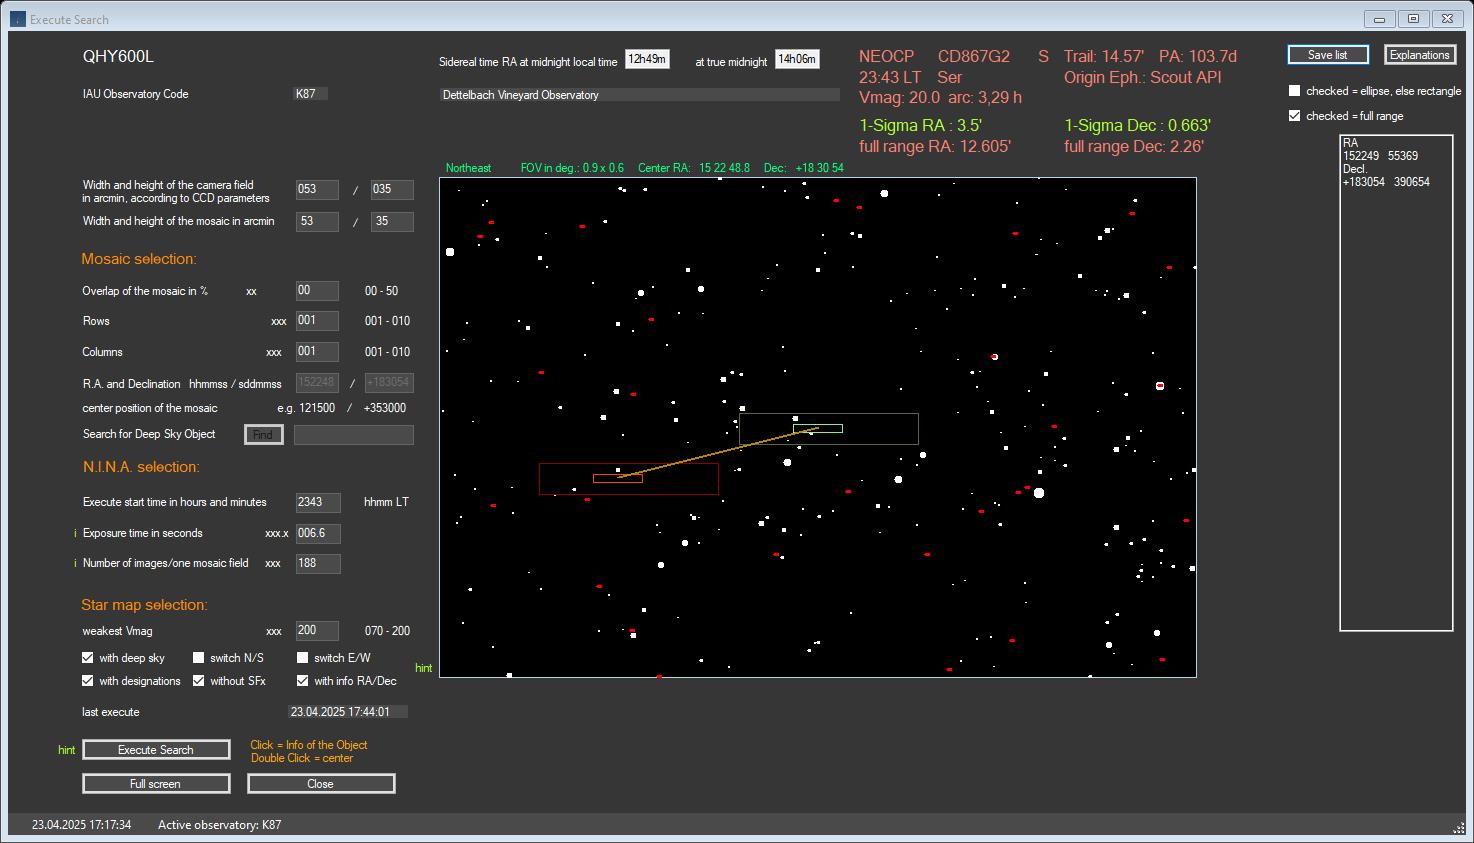
After performing the Execute Search, the star map is displayed with the central
search position in the middle of the single field / mosaic.
The green field borders show the dimensions of the image and the arrangement of
the image series based on the sensor size.
The star map shows all Yale bright stars, Tycho and Hipparchus stars and all
UCAC-3 stars up to about 17 mag.
In addition, all galaxies from the UCAC-3 catalog and the revised NGC/IC catalog
are displayed if checked.
The revised NGC/IC catalog is copyrighted by Dr. Wolfgang Steinike et al. Corresponding information on the use of this catalog can be found here.
Clicking any object displays all available information of
the star, galaxy or of the selected object from the solar system
below the star map.
(see the red circle in the star field).
With a double click on any object it can be centered in the middle of the
starmap. This new position is also used for the interface to N.I.N.A.
When using the S-function in Revise, the calculated start
position of the object is positioned in the middle of the star map
and the path length of the object according to the plan is shown with a dark
Goldenrod line.
The calculation of the path in the image is not based on the recording data of
the object,
but solely on the time difference between the start time of the object and the
start time of the next object in the plan.
In the example above, the center position was set to a star to get a different positioning of the object on the FoV of the starmap.
Also an advantage is the visibility of the path of the object
with the star background.
If the object is moving across stars, you may need to adjust the planning times
to ensure a reliable measurement.
1-Sigma fields:
The origin ephemeris is displayed.
NEO and comets are typically determined using JPL's Horizons API.
NEOCP objects access JPL's Scout API.
If the JPL API cannot be used, the MPC ephemeris is used. The display is in
red.
This can occur in rare cases, but it affects the determination of the object's
track, which can then no longer be displayed.
The object's position is then indicated by a small orange dot in the star map.
Mosaic objects are displayed with their mosaic number.
Extension of the Execute Search Window when using the
S-function in the Revise
Window for NEOCP objects:
In addition to the planned path of a NEOCP object, its 1-sigma deviations are
also displayed as as ellipses or rectangular if appropriate.
Based on the n-orbits set in the Object Selection settings for
the Scout API, the 1-sigma deviations of the NEOCP object are determined
and displayed here. A red color indicates a 1-sigma deviation that is greater
than the equipment's FoV and is not displayed in the image area.
If both the RA and Dec deviations are light blue, the 1-sigma values can be
displayed as ellipses or rectangular in the image area.
The green-yellow color indicates that the 1-sigma range is below one-tenth of
the FoV and the position is therefore largely secure.
If the 1-sigma values can reasonably be displayed in the image area, they are
displayed as two colored ellipses or rectangular.
The olive-colored ellipses or rectangular refers to the 1-sigma range of the object's starting
position, and the orange-red ellipses or rectangular to the final position.
For non-NEOCP objects, the 3-sigma values and graphics from the Horizons API are displayed.
The calculation of symmetry points when displaying ellipses and
rectangles for the 1-sigma deviations of NEOCP objects in Execute Search
has been precisely adapted to the data from the Scout API. This ensures the best
possible alignment with the deviation plot in Scout.
In addition to the 1-sigma deviations for NEOCP objects, the full range of all
deviations from the Scout API
is now optionally displayed graphically in the Execute Search Window.
The position map shows the R.A. and declination positions of the
mosaic and their values in milliseconds.
Milliseconds: from R.A. 00h00m00s and from Declination -90 on.
Copyright: The data comes from official access to web services from MPC, whose origins are the tireless measurements of dozens of professional and amateur observatories around the world